Abnormally large jumping num_mutations_to_index in FTS index while it is 100% ready

CouchBase version: 6.5.1 build 6299, run in GCP.

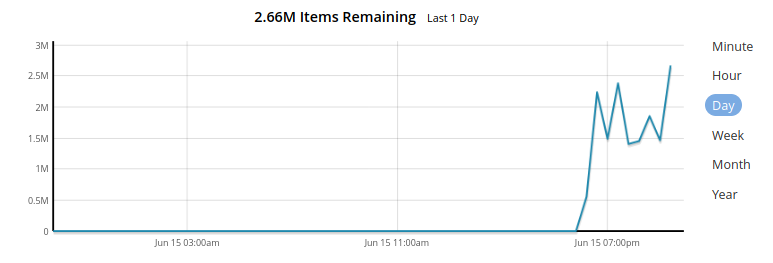
Today we suddenly started to experience a strange behavior of the num_mutations_to_index on our single FTS index: it fluctuates randomly between zero and 6 millions (we only have a quite moderate mutation rate of several dozens per second on a given bucket) for several hours. At the same time an index is constantly above 94% ready (100% ready most of the time).

This seems strange, so I also attach a random stats snapshot (passed through jq):

{
  "batch_bytes_added": 15939907503,
  "batch_bytes_removed": 15939805450,
  "curr_batches_blocked_by_herder": 18446744073709552000,
  "device-meta:device-meta-devices-list-v1:avg_grpc_internal_queries_latency": 444.864718,
  "device-meta:device-meta-devices-list-v1:avg_grpc_queries_latency": 8.486374,
  "device-meta:device-meta-devices-list-v1:avg_internal_queries_latency": 3.248349,
  "device-meta:device-meta-devices-list-v1:avg_queries_latency": 3.488489,
  "device-meta:device-meta-devices-list-v1:batch_merge_count": 0,
  "device-meta:device-meta-devices-list-v1:doc_count": 13626,
  "device-meta:device-meta-devices-list-v1:iterator_next_count": 0,
  "device-meta:device-meta-devices-list-v1:iterator_seek_count": 0,
  "device-meta:device-meta-devices-list-v1:last_access_time": "2022-06-15T18:22:05.486+00:00",
  "device-meta:device-meta-devices-list-v1:num_bytes_live_data": 0,
  "device-meta:device-meta-devices-list-v1:num_bytes_used_disk": 11908801,
  "device-meta:device-meta-devices-list-v1:num_bytes_used_disk_by_root": 2567877,
  "device-meta:device-meta-devices-list-v1:num_files_on_disk": 238,
  "device-meta:device-meta-devices-list-v1:num_mutations_to_index": 713142,
  "device-meta:device-meta-devices-list-v1:num_persister_nap_merger_break": 3764362,
  "device-meta:device-meta-devices-list-v1:num_persister_nap_pause_completed": 6569687,
  "device-meta:device-meta-devices-list-v1:num_pindexes_actual": 21,
  "device-meta:device-meta-devices-list-v1:num_pindexes_target": 21,
  "device-meta:device-meta-devices-list-v1:num_recs_to_persist": 0,
  "device-meta:device-meta-devices-list-v1:num_root_filesegments": 21,
  "device-meta:device-meta-devices-list-v1:num_root_memorysegments": 0,
  "device-meta:device-meta-devices-list-v1:reader_get_count": 0,
  "device-meta:device-meta-devices-list-v1:reader_multi_get_count": 0,
  "device-meta:device-meta-devices-list-v1:reader_prefix_iterator_count": 0,
  "device-meta:device-meta-devices-list-v1:reader_range_iterator_count": 0,
  "device-meta:device-meta-devices-list-v1:timer_batch_store_count": 0,
  "device-meta:device-meta-devices-list-v1:timer_data_delete_count": 1024,
  "device-meta:device-meta-devices-list-v1:timer_data_update_count": 7387046,
  "device-meta:device-meta-devices-list-v1:timer_opaque_get_count": 7385082,
  "device-meta:device-meta-devices-list-v1:timer_opaque_set_count": 7383290,
  "device-meta:device-meta-devices-list-v1:timer_rollback_count": 0,
  "device-meta:device-meta-devices-list-v1:timer_snapshot_start_count": 7381525,
  "device-meta:device-meta-devices-list-v1:total_bytes_indexed": 1510334272,
  "device-meta:device-meta-devices-list-v1:total_bytes_query_results": 8241,
  "device-meta:device-meta-devices-list-v1:total_compaction_written_bytes": 478867709080,
  "device-meta:device-meta-devices-list-v1:total_compactions": 0,
  "device-meta:device-meta-devices-list-v1:total_grpc_internal_queries": 135870,
  "device-meta:device-meta-devices-list-v1:total_grpc_queries": 59783,
  "device-meta:device-meta-devices-list-v1:total_grpc_queries_error": 0,
  "device-meta:device-meta-devices-list-v1:total_grpc_queries_slow": 16,
  "device-meta:device-meta-devices-list-v1:total_grpc_queries_timeout": 0,
  "device-meta:device-meta-devices-list-v1:total_grpc_request_time": 507340926713,
  "device-meta:device-meta-devices-list-v1:total_internal_queries": 22858,
  "device-meta:device-meta-devices-list-v1:total_queries": 10,
  "device-meta:device-meta-devices-list-v1:total_queries_error": 4,
  "device-meta:device-meta-devices-list-v1:total_queries_slow": 0,
  "device-meta:device-meta-devices-list-v1:total_queries_timeout": 0,
  "device-meta:device-meta-devices-list-v1:total_request_time": 35254836,
  "device-meta:device-meta-devices-list-v1:total_term_searchers": 1356470,
  "device-meta:device-meta-devices-list-v1:total_term_searchers_finished": 1356470,
  "device-meta:device-meta-devices-list-v1:writer_execute_batch_count": 0,
  "device-meta:device-meta-devices-list:avg_grpc_internal_queries_latency": 0,
  "device-meta:device-meta-devices-list:avg_grpc_queries_latency": 0,
  "device-meta:device-meta-devices-list:avg_internal_queries_latency": 0,
  "device-meta:device-meta-devices-list:avg_queries_latency": 21.700223,
  "device-meta:device-meta-devices-list:batch_merge_count": 0,
  "device-meta:device-meta-devices-list:doc_count": 0,
  "device-meta:device-meta-devices-list:iterator_next_count": 0,
  "device-meta:device-meta-devices-list:iterator_seek_count": 0,
  "device-meta:device-meta-devices-list:last_access_time": "",
  "device-meta:device-meta-devices-list:num_bytes_live_data": 0,
  "device-meta:device-meta-devices-list:num_bytes_used_disk": 0,
  "device-meta:device-meta-devices-list:num_bytes_used_disk_by_root": 0,
  "device-meta:device-meta-devices-list:num_files_on_disk": 0,
  "device-meta:device-meta-devices-list:num_mutations_to_index": 0,
  "device-meta:device-meta-devices-list:num_persister_nap_merger_break": 0,
  "device-meta:device-meta-devices-list:num_persister_nap_pause_completed": 0,
  "device-meta:device-meta-devices-list:num_pindexes_actual": 0,
  "device-meta:device-meta-devices-list:num_pindexes_target": 0,
  "device-meta:device-meta-devices-list:num_recs_to_persist": 0,
  "device-meta:device-meta-devices-list:num_root_filesegments": 0,
  "device-meta:device-meta-devices-list:num_root_memorysegments": 0,
  "device-meta:device-meta-devices-list:reader_get_count": 0,
  "device-meta:device-meta-devices-list:reader_multi_get_count": 0,
  "device-meta:device-meta-devices-list:reader_prefix_iterator_count": 0,
  "device-meta:device-meta-devices-list:reader_range_iterator_count": 0,
  "device-meta:device-meta-devices-list:timer_batch_store_count": 0,
  "device-meta:device-meta-devices-list:timer_data_delete_count": 0,
  "device-meta:device-meta-devices-list:timer_data_update_count": 0,
  "device-meta:device-meta-devices-list:timer_opaque_get_count": 0,
  "device-meta:device-meta-devices-list:timer_opaque_set_count": 0,
  "device-meta:device-meta-devices-list:timer_rollback_count": 0,
  "device-meta:device-meta-devices-list:timer_snapshot_start_count": 0,
  "device-meta:device-meta-devices-list:total_bytes_indexed": 0,
  "device-meta:device-meta-devices-list:total_bytes_query_results": 48287005,
  "device-meta:device-meta-devices-list:total_compaction_written_bytes": 0,
  "device-meta:device-meta-devices-list:total_compactions": 0,
  "device-meta:device-meta-devices-list:total_grpc_internal_queries": 0,
  "device-meta:device-meta-devices-list:total_grpc_queries": 0,
  "device-meta:device-meta-devices-list:total_grpc_queries_error": 0,
  "device-meta:device-meta-devices-list:total_grpc_queries_slow": 0,
  "device-meta:device-meta-devices-list:total_grpc_queries_timeout": 0,
  "device-meta:device-meta-devices-list:total_grpc_request_time": 0,
  "device-meta:device-meta-devices-list:total_internal_queries": 0,
  "device-meta:device-meta-devices-list:total_queries": 11822,
  "device-meta:device-meta-devices-list:total_queries_error": 1,
  "device-meta:device-meta-devices-list:total_queries_slow": 8,
  "device-meta:device-meta-devices-list:total_queries_timeout": 0,
  "device-meta:device-meta-devices-list:total_request_time": 256567906899,
  "device-meta:device-meta-devices-list:total_term_searchers": 0,
  "device-meta:device-meta-devices-list:total_term_searchers_finished": 0,
  "device-meta:device-meta-devices-list:writer_execute_batch_count": 0,
  "num_bytes_used_ram": 9268044600,
  "pct_cpu_gc": 0.0015641345992357118,
  "tot_batches_flushed_on_maxops": 0,
  "tot_batches_flushed_on_timer": 23465069,
  "tot_bleve_dest_closed": 19,
  "tot_bleve_dest_opened": 40,
  "tot_grpc_listeners_closed": 0,
  "tot_grpc_listeners_opened": 1,
  "tot_grpc_queryreject_on_memquota": 23,
  "tot_grpcs_listeners_closed": 0,
  "tot_grpcs_listeners_opened": 1,
  "tot_http_limitlisteners_closed": 0,
  "tot_http_limitlisteners_opened": 1,
  "tot_https_limitlisteners_closed": 0,
  "tot_https_limitlisteners_opened": 1,
  "tot_queryreject_on_memquota": 0,
  "tot_remote_grpc": 1330278,
  "tot_remote_grpc_tls": 0,
  "tot_remote_http": 439082,
  "tot_remote_http2": 0,
  "total_gc": 43695,
  "total_queries_rejected_by_herder": 23
}

I suspect there could be some integer overflow in the counter code:

At least one counter above has grown beyond the unit64 max value.

Could you take a look and tell if this is something expected or unexpected but has a known workaround. We currently rely onto this metric to be close to zero, so we can monitor any excessive lag in the index performance.

@vkhoroz you’re not looking at the correct code for the release you’re on. There were several fixes in how we report the index progress percentage in the latest of 6.6.x that you could benefit from.

num_mutations_to_index on that specific node that you pulled the stats snapshot from shows …

"device-meta:device-meta-devices-list-v1:num_mutations_to_index": 713142

This is determined by summing up the highest received sequence numbers from all bucket shards at the destination (within the FTS index) and subtracting that from the sum of the highest recorded sequence numbers from all the bucket shards at the source.

The 2.5 mil number is the sum of the num_mutations_to_index obtained from all the nodes where the FTS index is hosted in your cluster.

I do agree that the number is pretty large if you only do a dozen doc updates per sec on your bucket. Would you be willing to share the logs collected from all nodes where the FTS index is hosted so I can take a peek into the stats at a cluster level.

@abhinav thanks for looking at this.

We have identified the root cause of this issue which was a memory pressure.
We’ve set the memory quota for FTS service to 10000MB and this issue started to happen when the FTS memory usage per node was approaching 8000MB.

Closer look at FTS logs revealed a lot of warnings like this:

2022-06-22T15:23:05.928+00:00 [INFO] app_herder: indexing over indexQuota: 7680000000, memUsed: 8453991341, preIndexingMemory: 34933, indexes: 21, waiting: 43

which after some deduction allowed to realize that FTS doesn’t allow indexes to grow up to entire quota, but only allows them up to 75% of the quota (reserving the remainin memory chunk for other needs???).

So, once we increased the quota to 12000MB, the issue is now gone.

However, this high memory usage is quite concerning:

  • the bucket for an index currently only has around 22000 records, using just 272MB of space; of them only around 8000 records are eligible for the FTS index.
  • the index size on disk fluctuates around 32-36MB, which is fine for this small amount of data.
  • the number of data modification operations per second is around 20 with seldom spikes to 1500.
  • the number of search queries is extremely small, like a few runs per minute at most.
  • the FTS service memory usage reported by dashboard is 8-9GB on each of the 3 nodes in the cluster. This is clearly strange having the small amount of data and index size on disk.

Index definition attached below. As you can see, we only index/store a couple of fields, all these fields are controlled for max length (current maximum is 51 characters, average 26 characters).

(Note that FTS log size on each node currently exceeds 23MB of data; collecting logs via dashboard would take ages; but I could share a smaller extract of the latest logs if you point me as to which files and how much log lines (e.g. 10000) would be enough to look into this).

Could you suggest what we could be doing wrong with the index definition?

{
  "type": "fulltext-index",
  "name": "device-meta-devices-list-v1",
  "uuid": "1ff6d1afddce0312",
  "sourceType": "couchbase",
  "sourceName": "device-meta",
  "planParams": {
    "maxPartitionsPerPIndex": 32,
    "indexPartitions": 32,
    "numReplicas": 1
  },
  "params": {
    "doc_config": {
      "docid_prefix_delim": "",
      "docid_regexp": "",
      "mode": "type_field",
      "type_field": "doctype"
    },
    "mapping": {
      "analysis": {},
      "default_analyzer": "keyword",
      "default_datetime_parser": "disabled",
      "default_field": "_all",
      "default_mapping": {
        "dynamic": false,
        "enabled": false
      },
      "default_type": "_default",
      "index_dynamic": false,
      "store_dynamic": false,
      "type_field": "_type",
      "types": {
        "device": {
          "dynamic": false,
          "enabled": true,
          "properties": {
            "group_id": {
              "dynamic": false,
              "enabled": true,
              "fields": [
                {
                  "index": true,
                  "name": "group_id",
                  "type": "text"
                }
              ]
            },
            "name": {
              "dynamic": false,
              "enabled": true,
              "fields": [
                {
                  "docvalues": true,
                  "index": true,
                  "name": "name",
                  "type": "text"
                }
              ]
            },
            "owner": {
              "dynamic": false,
              "enabled": true,
              "fields": [
                {
                  "docvalues": true,
                  "index": true,
                  "name": "owner",
                  "type": "text"
                }
              ]
            },
            "repo_id": {
              "dynamic": false,
              "enabled": true,
              "fields": [
                {
                  "index": true,
                  "name": "repo_id",
                  "type": "text"
                }
              ]
            },
            "tag": {
              "dynamic": false,
              "enabled": true,
              "fields": [
                {
                  "index": true,
                  "name": "tag",
                  "type": "text"
                }
              ]
            },
            "uuid": {
              "dynamic": false,
              "enabled": true,
              "fields": [
                {
                  "index": true,
                  "name": "uuid",
                  "type": "text"
                }
              ]
            }
          }
        }
      }
    },
    "store": {
      "indexType": "scorch"
    }
  },
  "sourceParams": null
}

FTS doesn’t allow indexes to grow up to entire quota, but only allows them up to 75% of the quota (reserving the remainin memory chunk for other needs???).

That is an accurate observation and is by design.
FTS throttles indexing progress when memory utilization reaches 75% of the quota and queries are rejected when memory utilization hits 90%. The reason for this is to keep some leeway for ingested documents (temporary), cluster ops like rebalance, compaction (via merging), any memory spikes from resource intensive queries and any other overhead, while respecting the quota set for the FTS process.

the FTS service memory usage reported by dashboard is 8-9GB on each of the 3 nodes in the cluster. This is clearly strange having the small amount of data and index size on disk.

If the quota allows for it, a significant portion of the index segments are memory-mapped by the FTS process for faster access to indexed content.

Increased rate of ingest can also cause momentary higher memory consumption.

Would you grab the memory profile and share the pprof here, so we can take a look at what’re the significant resource consumers. You can do this by running the following command -

curl -XPOST http://<ip>:8094/api/runtime/profile/memory -u <username>:<password>

You can find the heap profile within this directory’s hierarchy - /opt/couchbase/… (I forget where exactly it gets placed). It’ll have the name: run-memory.pprof

Your index definition generally looks ok to me. You have the following fields indexed under the type mapping device:

  • group_id : text
  • name: text, docvalues
  • owner: text, docvalues
  • repo_id: text
  • tag: text
  • uuid: text

docvalues are necessary only for those fields over which you want to support sorting and faceting. Otherwise they can be disabled to save up some resources.

You’re applying the keyword analyzer (indexes the entire content of the field as a single token) over all the text fields, which I suppose is necessary for your use case.

@vkhoroz ,

From the app_herder logs, quick query is - Are all these 64 partitions(primary + replica) in a single FTS node? Or three nodes?
There will be 64 DCP connections trying to ingest the mutations and that could contribute to the high memory consumption.

Given the amount of data you are indexing, I don’t think you need 32 partitions here.
Reducing the index partition count to ~3 or 2 should alleviate your RAM usage/app_herder concerns is my read here.

Was there any specific reason to choose 32 partitions for the index?

(Also, please note that partition count change is an index rebuild operation)

Cheers!

@abhinav @sreeks Thanks for your responses.

If the quota allows for it, a significant portion of the index segments are memory-mapped by the FTS process for faster access to indexed content.
Increased rate of ingest can also cause momentary higher memory consumption.

In general it makes sense. Though in our case this leads to an unexpected situation: when cbft approaches the 75% of quota - it starts to aggressively do some inner compaction/optimization chores which result into two bad things:

  • the num_mutations_to_index misbehaves (jumps between zero and 5’000’000 value back and force) and the index readiness jumps between 94% and 100% all the time; that is annoying as we’ve attached the alert to that metric which signals us about the lag in indexing data modifications.
  • what’s worse, the lag between actual data modifications and their reflection in the index increases from the normal sub-second to 5-10 minutes delay; so much that becomes visible to the end users.

Is there any way to configure the cbft to memory-map segments in a more conservative way once it approaches the 75% limit?

Would you grab the memory profile and share the pprof here, so we can take a look at what’re the significant resource consumers. You can do this by running the following command -
You can find the heap profile within this directory’s hierarchy - /opt/couchbase/… (I forget where exactly it gets placed). It’ll have the name: run-memory.pprof

Yes, I found it at /opt/couchbase/var/lib/couchbase/run-memory.pprof. Here is the top:

$ ~/go/bin/pprof -top ~/run-memory.pprof 
File: cbft
Type: inuse_space
Time: Jun 23, 2022 at 4:21pm (EEST)
Showing nodes accounting for 6203.08MB, 97.61% of 6354.91MB total
Dropped 167 nodes (cum <= 31.77MB)
      flat  flat%   sum%        cum   cum%
 3969.26MB 62.46% 62.46%  3969.26MB 62.46%  google.golang.org/grpc/internal/transport.newBufWriter (inline)
 2005.27MB 31.55% 94.01%  2005.27MB 31.55%  bufio.NewReaderSize (inline)
   78.03MB  1.23% 95.24%    78.03MB  1.23%  runtime.malg
   53.01MB  0.83% 96.08%  6088.48MB 95.81%  google.golang.org/grpc/internal/transport.newHTTP2Server
   37.50MB  0.59% 96.67%    39.69MB  0.62%  time.NewTimer
      22MB  0.35% 97.01%    61.70MB  0.97%  google.golang.org/grpc/internal/transport.(*http2Server).keepalive
      20MB  0.31% 97.33%    99.89MB  1.57%  runtime.systemstack
      16MB  0.25% 97.58%    38.50MB  0.61%  google.golang.org/grpc/internal/transport.newLoopyWriter
       2MB 0.031% 97.61%  6014.54MB 94.64%  google.golang.org/grpc/internal/transport.newFramer
         0     0% 97.61%  6093.24MB 95.88%  google.golang.org/grpc.(*Server).Serve.func3
         0     0% 97.61%  6093.24MB 95.88%  google.golang.org/grpc.(*Server).handleRawConn
         0     0% 97.61%  6088.48MB 95.81%  google.golang.org/grpc.(*Server).newHTTP2Transport
         0     0% 97.61%  6088.48MB 95.81%  google.golang.org/grpc/internal/transport.NewServerTransport
         0     0% 97.61%    49.50MB  0.78%  google.golang.org/grpc/internal/transport.newHTTP2Server.func2
         0     0% 97.61%    99.89MB  1.57%  runtime.mstart
         0     0% 97.61%    79.89MB  1.26%  runtime.newproc.func1
         0     0% 97.61%    79.89MB  1.26%  runtime.newproc1

I’ll attach the full file separately. From the above it seems that Srikanth’s assumption is relevant, so I need to check that.

From the app_herder logs, quick query is - Are all these 64 partitions(primary + replica) in a single FTS node? Or three nodes?
There will be 64 DCP connections trying to ingest the mutations and that could contribute to the high memory consumption.

It is spread across the 3 nodes, so I assume we’d have on average 21 DCP connection per node, right?

Given the amount of data you are indexing, I don’t think you need 32 partitions here.
Reducing the index partition count to ~3 or 2 should alleviate your RAM usage/app_herder concerns is my read here.
Was there any specific reason to choose 32 partitions for the index?

It was an arbitrary number based on the FTS documentation which says that higher values allow for the faster indexing. We’ve noticed that with the default low value modifications indexing sometimes takes a couple of seconds, while this arbitrary higher number (32) gave us a sub-second reaction time which is nice.

Let me check if reducing the partition number will take the memory down and report back.

run-memory.zip (137.4 KB)

Looking at the memory profile …

The highest consumer is gRPC which indicates that it has to do with the scatter gather requests for the queries you’re running. FTS internally uses gRPC for scatter gather requests of queries.

Regarding the number of connections set up by the FTS index for ingesting documents -
If this is a 7.0+ index, we have a concept of connection sharing (for as long as the source is the same). The default factor is 6, so this means 6 index partitions share a single connection to obtain content from the bucket shards.

However, since you’re on 6.5.1, there’d be 1 connection per partition per data node => seeing you have 64 partitions distributed across 3 FTS nodes - that’s 21-22 connections per data node.

Higher partitioning will increase the rate of ingest (parallelism) - resources permitting, but will use up more memory.

I think if you’d like to bring the memory usage down - you should start by reducing your partition count.

Additionally, 6.5.x releases had a memory leak issue (during connection reset) that was addressed in 6.6.3, so I recommend you upgrade to the latest of the 6.6.x releases as well.

Here is what happened when I decreased the amount of partitions for the index.

Initial partitions were 32 * 2 (1 replica), total FTS memory consumption on a profiled node was 8.9GB, and memory profiler give this (top entries)
run-memory.zip (137.4 KB)

Time: Jun 23, 2022 at 4:21pm (EEST)
Showing nodes accounting for 6203.08MB, 97.61% of 6354.91MB total
Dropped 167 nodes (cum <= 31.77MB)
      flat  flat%   sum%        cum   cum%
 3969.26MB 62.46% 62.46%  3969.26MB 62.46%  google.golang.org/grpc/internal/transport.newBufWriter (inline)
 2005.27MB 31.55% 94.01%  2005.27MB 31.55%  bufio.NewReaderSize (inline)
   78.03MB  1.23% 95.24%    78.03MB  1.23%  runtime.malg
   53.01MB  0.83% 96.08%  6088.48MB 95.81%  google.golang.org/grpc/internal/transport.newHTTP2Server
   37.50MB  0.59% 96.67%    39.69MB  0.62%  time.NewTimer
      22MB  0.35% 97.01%    61.70MB  0.97%  google.golang.org/grpc/internal/transport.(*http2Server).keepalive
      20MB  0.31% 97.33%    99.89MB  1.57%  runtime.systemstack
      16MB  0.25% 97.58%    38.50MB  0.61%  google.golang.org/grpc/internal/transport.newLoopyWriter
       2MB 0.031% 97.61%  6014.54MB 94.64%  google.golang.org/grpc/internal/transport.newFramer

After decreasing partitions to 6 * 2 (1 replica) I expected the 5-fold decrease in the memory consumption from the transport.newFramer and related objects. However, what I observed was quite unexpected.

At first, memory consumption increased to 10.1GB on a given node (I assume that was a temporal memory leak from non-garbage collected objects), memory profiler gives this:
run-memory-1.zip (143.8 KB)

Time: Jun 23, 2022 at 5:09pm (EEST)
Showing nodes accounting for 6212.54MB, 97.58% of 6366.83MB total
Dropped 151 nodes (cum <= 31.83MB)
      flat  flat%   sum%        cum   cum%
 3976.17MB 62.45% 62.45%  3976.17MB 62.45%  google.golang.org/grpc/internal/transport.newBufWriter (inline)
 2006.82MB 31.52% 93.97%  2006.82MB 31.52%  bufio.NewReaderSize (inline)
   78.03MB  1.23% 95.20%    78.03MB  1.23%  runtime.malg
   53.01MB  0.83% 96.03%  6096.95MB 95.76%  google.golang.org/grpc/internal/transport.newHTTP2Server
   37.50MB  0.59% 96.62%    39.69MB  0.62%  time.NewTimer
      22MB  0.35% 96.96%    61.70MB  0.97%  google.golang.org/grpc/internal/transport.(*http2Server).keepalive
   20.50MB  0.32% 97.29%   100.39MB  1.58%  runtime.systemstack
   16.50MB  0.26% 97.55%       39MB  0.61%  google.golang.org/grpc/internal/transport.newLoopyWriter
       2MB 0.031% 97.58%     6023MB 94.60%  google.golang.org/grpc/internal/transport.newFramer

It was like that for around 20 minutes, after that total FTS memory usage decreased to 8.5GB, and the profiler gives this:
run-memory-2.zip (34.1 KB)

Time: Jun 23, 2022 at 5:16pm (EEST)
Showing nodes accounting for 4205.06MB, 97.28% of 4322.47MB total
Dropped 129 nodes (cum <= 21.61MB)
      flat  flat%   sum%        cum   cum%
 2767.26MB 64.02% 64.02%  2767.26MB 64.02%  google.golang.org/grpc/internal/transport.newBufWriter (inline)
 1352.29MB 31.28% 95.31%  1352.29MB 31.28%  bufio.NewReaderSize (inline)
   39.01MB   0.9% 96.21%    39.01MB   0.9%  runtime.malg
   28.01MB  0.65% 96.86%  4201.06MB 97.19%  google.golang.org/grpc/internal/transport.newHTTP2Server
      10MB  0.23% 97.09%    49.97MB  1.16%  runtime.systemstack
    7.50MB  0.17% 97.26%    24.60MB  0.57%  google.golang.org/grpc/internal/transport.(*http2Server).keepalive
       1MB 0.023% 97.28%  4150.55MB 96.02%  google.golang.org/grpc/internal/transport.newFramer

The service restart didn’t change the memory consumption.

So, now the memory usage is almost half GB smaller on every node, but that is not what would be expected if the majority of memory usage went to the DCP connections from index partitions.
Still, the profiler shows minus 2GB in usage, so I assume that the freed memory was immediately used for something unaccounted by the profiler (e.g. more segments memory maps or what?).

Any further ideas are welcome?

Additionally, 6.5.x releases had a memory leak issue (during connection reset) that was addressed in 6.6.3, so I recommend you upgrade to the latest of the 6.6.x releases as well.

Let me check if we can afford upgrading in the nearest future.
Upgrades is generally not something easily planned, but if that can potentially help; I’d need to verify the new version on the test deployment. That takes time and effort.

That could be a potential memory usage trigger except that it is not, as there were zero queries running during the profiler period. See on graphs image:

@vkhoroz would you collect logs from the search nodes (via cbcollect_info) and share them here?
You will be able to do this from the “Logs” tab on your admin console.

@abhinav I’m sorry, the forum says Sorry, the file you are trying to upload is too big (maximum size is 8 MB). Which is expected as the cbcollect_info.zip has 437MB in size, even when I collect logs with redacted sensitive data.

Please, let me know the exact files you’re interested in based on this breakdown:

Archive:  /home/vkhoroz/cbcollect_info.zip
  Length      Date    Time    Name
---------  ---------- -----   ----
 35585859  2022-06-23 15:45   <redacted>_20220623-153815/couchbase.log
       37  2022-06-23 15:39   <redacted>_20220623-153815/systemd_journal.gz
      159  2022-06-23 15:39   <redacted>_20220623-153815/syslog.tar.gz
    52315  2022-06-23 15:39   <redacted>_20220623-153815/indexer_pprof.log
    37542  2022-06-23 15:40   <redacted>_20220623-153815/indexer_cprof.log
 22780430  2022-06-23 15:40   <redacted>_20220623-153815/indexer_mprof.log
    22028  2022-06-23 15:40   <redacted>_20220623-153815/projector_pprof.log
 74139673  2022-06-23 15:40   <redacted>_20220623-153815/fts_diag.json
   118840  2022-06-23 15:40   <redacted>_20220623-153815/analytics_diag.json
    23511  2022-06-23 15:40   <redacted>_20220623-153815/analytics_pprof.log
        2  2022-06-23 15:40   <redacted>_20220623-153815/eventing_stats.json
    38339  2022-06-23 15:40   <redacted>_20220623-153815/eventing_pprof.log
        3  2022-06-23 15:40   <redacted>_20220623-153815/eventing_insights.log
    17901  2022-06-23 15:40   <redacted>_20220623-153815/goxdcr_pprof.log
249427735  2022-06-23 15:40   <redacted>_20220623-153815/memcached.log
    15764  2022-06-23 15:40   <redacted>_20220623-153815/ini.log
430644903  2022-06-23 15:41   <redacted>_20220623-153815/diag.log
        0  2022-06-23 15:41   <redacted>_20220623-153815/master_events.log
405967620  2022-06-23 15:42   <redacted>_20220623-153815/ns_server.debug.log
382393742  2022-06-23 15:42   <redacted>_20220623-153815/ns_server.info.log
   615387  2022-06-23 15:42   <redacted>_20220623-153815/ns_server.error.log
126771230  2022-06-23 15:42   <redacted>_20220623-153815/ns_server.couchdb.log
      221  2022-06-23 15:42   <redacted>_20220623-153815/ns_server.xdcr_target.log
      209  2022-06-23 15:42   <redacted>_20220623-153815/ns_server.views.log
      231  2022-06-23 15:42   <redacted>_20220623-153815/ns_server.mapreduce_errors.log
385955998  2022-06-23 15:42   <redacted>_20220623-153815/ns_server.stats.log
 43707933  2022-06-23 15:42   <redacted>_20220623-153815/ns_server.babysitter.log
  4613189  2022-06-23 15:42   <redacted>_20220623-153815/ns_server.reports.log
406523348  2022-06-23 15:42   <redacted>_20220623-153815/ns_server.http_access.log
389254019  2022-06-23 15:42   <redacted>_20220623-153815/ns_server.http_access_internal.log
380465791  2022-06-23 15:42   <redacted>_20220623-153815/ns_server.ns_couchdb.log
412996939  2022-06-23 15:42   <redacted>_20220623-153815/ns_server.goxdcr.log
384596351  2022-06-23 15:42   <redacted>_20220623-153815/ns_server.query.log
382254835  2022-06-23 15:42   <redacted>_20220623-153815/ns_server.projector.log
415207622  2022-06-23 15:42   <redacted>_20220623-153815/ns_server.indexer.log
389024900  2022-06-23 15:42   <redacted>_20220623-153815/ns_server.fts.log
382522166  2022-06-23 15:43   <redacted>_20220623-153815/ns_server.metakv.log
390596427  2022-06-23 15:43   <redacted>_20220623-153815/ns_server.json_rpc.log
402752999  2022-06-23 15:43   <redacted>_20220623-153815/ns_server.eventing.log
  3932260  2022-06-23 15:43   <redacted>_20220623-153815/ns_server.analytics_info.log
451398824  2022-06-23 15:43   <redacted>_20220623-153815/ns_server.analytics_debug.log
      345  2022-06-23 15:43   <redacted>_20220623-153815/ns_server.analytics_shutdown.log
  1239814  2022-06-23 15:43   <redacted>_20220623-153815/ns_server.analytics_error.log
  1293233  2022-06-23 15:43   <redacted>_20220623-153815/ns_server.analytics_warn.log
     1350  2022-06-23 15:43   <redacted>_20220623-153815/ns_server.analytics_dcpdebug.log
      233  2022-06-23 15:43   <redacted>_20220623-153815/ns_server.analytics_trace.json
439739695  2022-06-23 15:43   <redacted>_20220623-153815/ns_server.analytics_access.log
   258646  2022-06-23 15:43   <redacted>_20220623-153815/ns_server.analytics_cbas_debug.log
 40451313  2022-06-23 15:46   <redacted>_20220623-153815/stats.log
    14718  2022-06-23 15:43   <redacted>_20220623-153815/fts_store_stats.log
     1668  2022-06-23 15:43   <redacted>_20220623-153815/ddocs.log
  2007200  2022-06-23 15:45   <redacted>_20220623-153815/couchstore_local.log
    22897  2022-04-18 09:10   <redacted>_20220623-153815/users.dets
  1849987  2021-09-17 12:51   <redacted>_20220623-153815/rebalance_report_2021-09-17T12:51:46Z.json
  1993819  2021-09-17 13:43   <redacted>_20220623-153815/rebalance_report_2021-09-17T13:38:42Z.json
  1852165  2021-09-17 13:45   <redacted>_20220623-153815/rebalance_report_2021-09-17T13:45:37Z.json
  1849464  2021-09-17 13:29   <redacted>_20220623-153815/rebalance_report_2021-09-17T13:29:32Z.json
  1989884  2021-09-17 13:19   <redacted>_20220623-153815/rebalance_report_2021-09-17T13:19:47Z.json
351704263  2022-06-23 15:46   <redacted>_20220623-153815/stats_archives.json
 68162009  2022-06-23 15:46   <redacted>_20220623-153815/kv_trace.json
   439752  2022-06-23 15:46   <redacted>_20220623-153815/cbcollect_info.log
---------                     -------
7869329737                     61 files

I bet you only need a tail of some of these files. Or otherwise, please, let me know the fts share (or anything) to upload to.

Will you be able to reach out to Couchbase support to create a case? We’ve a process in place for you to upload logs from your cluster.

Let me try to do that.

Additionally, 6.5.x releases had a memory leak issue (during connection reset) that was addressed in 6.6.3, so I recommend you upgrade to the latest of the 6.6.x releases as well.

Meawhile, I looked at our staging CouchBase instance (where we also run stress, load, and performance tests); which was created later and contains a newer version of CouchBase: 6.6.3 build 9808. And on this instance I don’t see the observed problem:

  • bucket stats: 267’460 records, on disk 723MB, in memory 529MB;
  • fts stats: 133’727 eligible records, on disk 205MB, memory usage (per node) 146MB + 195MB + 100MB

The above numbers make much more sense to me, and that’s what I’d expect from the FTS behavior.
So it seems like our production CouchBase version is indeed victim to some nasty FTS memory leak.

The primary reason why we did not upgrade our production to the same version yet is that we experience another nasty problem in staging: once every 1-2 weeks the indexer process in our staging hangs and we need to restart it manually. That’s not a big deal for staging as we only use it for tests, but it would be insane for the production.

@abhinav Is there any particular version of CouchBase from the 6.6.x series which you would recommend us to upgrade to as the ultra stable (including indexer and FTS), based on either customer feedback or some of your internal marking.

1 Like

@vkhoroz Ok, so it’s quite possible it’s the memory leak (that was addressed in the 6.6.3 release) that’s the root cause for your situation.

I’d recommend picking up any 6.6.3+ release for your production deployments, perhaps the latest: 6.6.5.

2 Likes

@abhinav thank you for the support.
I will let you know how the 6.6.5 goes after a few weeks we’ll use for probation.

@abhinav I am back with the results.

We were testing the 6.6.5 in our test/staging env for quite some time and it behaved much better than the previous version by all parameters.
So, this week we upgraded our production to use CouchBase 6.6.5; and it is a huge relief for us.

Just a memory usage graph from one of our nodes at a time of upgrade shows it all:

Thank you for your support.

1 Like

@vkhoroz ,

Just FYI, Search is much much better in the 7.X latest Server release.

Cheers!