I have 3 Couchbase nodes in my cluster, each node has 10 CPU cores (2.2 GHz) and 50 Gigabyte ram.
I deleted a bucket with 100 million data (70 G) 3 hours ago, but Couchbase show it as an orphan bucket, and it stops all of my works with Couchbase.
is it normal that takes more than 3 hours just for deleting a bucket?
Hi @zarrin,
What version of Couchbase Server are you using? Could it be possible that a client is still connected?
Here are a couple of tickets that you might want to take a look at:
- https://issues.couchbase.com/browse/MB-19430 (bucket deletion stalls, fixed in 4.5)
- https://issues.couchbase.com/browse/MB-26341 (bucket could not finish being deleted, may be due to client still being connected)
Thank you @matthew.groves
I am using Couchbase Version: 4.6.3-4136 Enterprise Edition (build-4136) on 3 nodes.
at that moment no client connected to Couchbase.
I checked it after 1 day and the orphan bucket disappeared, but as I knew ( I was awake and watching Couchbase Web Console) the process of deleting bucket was taken more than 5 hours.
Couchbase recommends a min of 20-30% of your data in memory. Are you running other services besides Data in the three node cluster?
Have you set Couchbase with the correct ulimit settings
and
OS tunings?
2 Likes
Thank you @househippo for your good points.
I was configured Couchbase a month ago and here is system status :
[root@vmi138297 ~]# cat /etc/security/limits.conf
couchbase hard nofile 40960
couchbase hard core unlimited
[root@vmi138297 ~]# sysctl vm.max_map_count
vm.max_map_count = 65530
[root@vmi138297 ~]# cat /etc/sysctl.conf
kernel.panic = 10
vm.swappiness = 0
[root@vmi138297 ~]# cat /proc/sys/vm/swappiness
0
[root@vmi138297 ~]# cat /sys/kernel/mm/transparent_hugepage/enabled
always madvise [never]
[root@vmi138297 ~]# cat /sys/kernel/mm/transparent_hugepage/defrag
always madvise [never]
[root@vmi138297 ~]# ulimit -a
core file size (blocks, -c) 0
data seg size (kbytes, -d) unlimited
scheduling priority (-e) 0
file size (blocks, -f) unlimited
pending signals (-i) 200537
max locked memory (kbytes, -l) 64
max memory size (kbytes, -m) unlimited
open files (-n) 1024
pipe size (512 bytes, -p) 8
POSIX message queues (bytes, -q) 819200
real-time priority (-r) 0
stack size (kbytes, -s) 8192
cpu time (seconds, -t) unlimited
max user processes (-u) 200537
virtual memory (kbytes, -v) unlimited
file locks (-x) unlimited
[root@vmi138297 ~]# su - couchbase
This account is currently not available.
I was set ulimit to 40960 (as root user) but as you see above (Bold Lines), It was reset maybe by a restart.
on the other hand, I was appended bellow lines into /etc/security/limits.conf .
couchbase hard nofile 40960
couchbase hard core unlimited
I expected nofile of couchbase user was set but I don’t know how to check that.
any advice and suggestions will be greatly appreciated.
to double check that the couchbase processes have taken the new setting during run time you can do.
#cat /proc/{PID}/limits … you can use the memcache.bin PID
Looks like the ns_server(Cluster Manager) is eventually getting the trigger or call for deleting the vBuckets(shards of a bucket).
Do you know if a particular node is the lazy one deleting the files after the bucket delete request?
or
Do all nodes eventually delete but super slow?
thanks again @househippo
[root@vmi137634 ~]# ps aux | grep memcached
couchba+ 1372 28.6 59.4 32538308 30507720 ? Ssl Oct20 55:13 /opt/couchbase/bin/memcached -C /opt/couchbase/var/lib/couchbase/config/memcached.json
[root@vmi137634 ~]# cat /proc/1372/limits
Limit Soft Limit Hard Limit Units
Max cpu time unlimited unlimited seconds
Max file size unlimited unlimited bytes
Max data size unlimited unlimited bytes
Max stack size 8388608 unlimited bytes
Max core file size 0 unlimited bytes
Max resident set unlimited unlimited bytes
Max processes 200537 200537 processes
Max open files 40960 40960 files
Max locked memory unlimited unlimited bytes
Max address space unlimited unlimited bytes
Max file locks unlimited unlimited locks
Max pending signals 200537 200537 signals
Max msgqueue size 819200 819200 bytes
Max nice priority 0 0
Max realtime priority 0 0
Max realtime timeout unlimited unlimited us
all of VPS has same configuration and they are dedicated to Couchbase.
I want to export my MongoDB Data to Couchbase (1.3 Milliard Document), but I have many problems with that
at initial time of exporting every things was normal (10k OP/Sec ) but exporting rate became lower and lower.
It was just (30 OP/Sec ) when exported data reached to near 100 million.
after that, all of operation with Couchbase was very slow.
here is the buckets

for a test I write bellow code, that always returns BackpressureException and sometimes Timeout error.
public void couchbaseTest(){
    CouchbaseEnvironment env = DefaultCouchbaseEnvironment.builder()
            .connectTimeout(30000)
            .kvTimeout(30000)
            .viewTimeout(150000)
            .managementTimeout(150000)
            .searchTimeout(150000)
            .queryTimeout(150000)
            .analyticsTimeout(150000)
            .socketConnectTimeout(3000)
            .maxRequestLifetime(150000)
            .continuousKeepAliveEnabled(true)
            .build();
    Cluster cluster = CouchbaseCluster.create("couchbase://173.212.xxx.xxx","couchbase://173.212.xxx.xxx","couchbase://173.212.xxx.xxx");
    Bucket bucket = cluster.openBucket("Telemine", "password");
    Bucket messagesBucket = cluster.openBucket("Messages", "password");
    Bucket testBucket = cluster.openBucket("Test", "password");
    ViewResult result = bucket.query(ViewQuery.from("urls", "urls").includeDocs(true));
    int i=0;
    for (ViewRow row : result) {
            System.out.println(row.document());
            testBucket.insert(row.document());
        }
}
here is the error that always appear before 128 Document inserted.
Exception in thread “main” rx.exceptions.CompositeException: 1 exceptions occurred.
at rx.internal.operators.OperatorMerge$MergeSubscriber.reportError(OperatorMerge.java:268)
at rx.internal.operators.OperatorMerge$MergeSubscriber.checkTerminate(OperatorMerge.java:818)
at rx.internal.operators.OperatorMerge$MergeSubscriber.emitLoop(OperatorMerge.java:699)
at rx.internal.operators.OperatorMerge$MergeSubscriber.emit(OperatorMerge.java:568)
at rx.internal.operators.OperatorMerge$MergeSubscriber.onNext(OperatorMerge.java:249)
at rx.internal.operators.OperatorMerge$MergeSubscriber.onNext(OperatorMerge.java:148)
at rx.internal.operators.OnSubscribeMap$MapSubscriber.onNext(OnSubscribeMap.java:77)
at rx.internal.operators.OnSubscribeMap$MapSubscriber.onNext(OnSubscribeMap.java:77)
at rx.internal.operators.OperatorObserveOn$ObserveOnSubscriber.call(OperatorObserveOn.java:224)
at rx.internal.schedulers.ScheduledAction.run(ScheduledAction.java:55)
at java.util.concurrent.Executors$RunnableAdapter.call(Executors.java:511)
at java.util.concurrent.FutureTask.run(FutureTask.java:266)
at java.util.concurrent.ScheduledThreadPoolExecutor$ScheduledFutureTask.access$201(ScheduledThreadPoolExecutor.java:180)
at java.util.concurrent.ScheduledThreadPoolExecutor$ScheduledFutureTask.run(ScheduledThreadPoolExecutor.java:293)
at java.util.concurrent.ThreadPoolExecutor.runWorker(ThreadPoolExecutor.java:1149)
at java.util.concurrent.ThreadPoolExecutor$Worker.run(ThreadPoolExecutor.java:624)
at java.lang.Thread.run(Thread.java:748)
ComposedException 1 :
com.couchbase.client.core.BackpressureException
I just have 2 Index. one Primary Index and one View Index on Telemine Bucket.
and I set Message Bucket Cache Metadata to Full Ejection ( because on my first try , Couchbase warning about MetaData makes Ram full)
I’m stocked in this state, not able to export data and not able to start my application.
thank you for any advice.
@zarrin,
OPS
In the below example bucket stats page in row 2 , column 3 what is your active doc resident%?
When you run your test inserting docs into CB do you see increase in row 3 , column 1 temp OOM?
When you run your test do you see increase in row 1 , column 2 Cache Miss Ratio(% of disk reads)?
VIEWS
You should use N1QL queries with specific indexes to match your queries it will be more performant.
You should probably drop your primary index its really doesn’t do you much good with the amount of documents you have.
CLUSTER
Sounds like you have a cluster that looks like the first IMAGE (IMAGE BELOW).
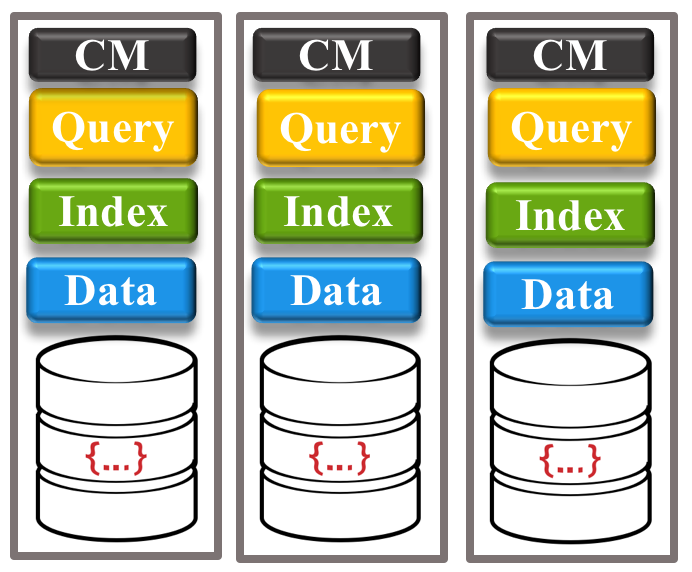
VS
