@drak25
I took the code you posted and split it into three different console applications; the only difference was that each application took that loop (the while(true)) and instead looped 10 times through the Get and each one was dedicated to a specific SDK version: 1.3.11, 2.0.0.1 and 2.0.1 (which will soon be released). I ran each against the same Couchbase instance (3.0.2-26 Enterprise Edition (build-26)) running on localhost. I used the same bucket: the default bucket.
Here is the code an results for 1.3.11:
class Program
{
     static void Main(string[] args)
     {
           var client13 = new CouchbaseClient("couchbase", "default", "");

           List<string> keys = new List<string>();

          for (int ii = 0; ii < 1000; ii++)
          {
             string k = "tk" + ii;
             client13.Store(StoreMode.Set, k, "1");
             keys.Add(k);
          }
          var count = 0;
          while (count++ < 10)
          {
                Stopwatch swx = new Stopwatch();
                swx.Start();
                var mg1 = client13.Get(keys);
                swx.Stop();
                Console.WriteLine("Lib 1.3.9: " + swx.ElapsedMilliseconds + "ms");
                swx.Reset();
           }
           Console.ReadKey();
           }
    }
Here is the screenshot:
Here is the code for 2.0.0.1 (the 2.0 SDK on NuGet):
class Program
{
    static void Main(string[] args)
    {
        var cluster = new Cluster("couchbaseClients/couchbase");
        var bucket201 = cluster.OpenBucket();

        List<string> keys = new List<string>();

        for (int ii = 0; ii < 1000; ii++)
        {
            string k = "tk" + ii;
            bucket201.Upsert(k, "1");
            keys.Add(k);
        }

    var count = 0;
    while (count++ < 10)
    {
        Stopwatch swx = new Stopwatch();
        swx.Start();
        var mg2 = bucket201.Get<string>(keys);
        swx.Stop();
        Console.WriteLine("Lib 2.0.0: " + swx.ElapsedMilliseconds + "ms");
    }
    Console.Read();
 }
}
And here is a screenshot of the results:
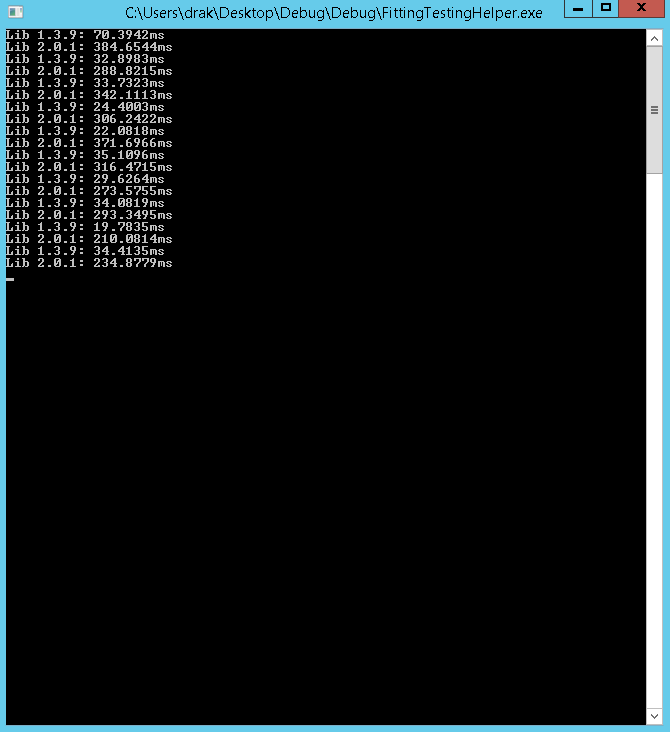
I also did the same on a build of the next version of the SDK to be released (soon), 2.0.1 - the code is the same, so I won’t post, but here is the screenshot:
As you can see between 1.3.11 and 2.0.0.1, the performance is much closer; 2.0.0.1 has much more variance though with the max of 108ms and a min of 26ms for an avg of 44.8ms. 1.3.1 has a max of 68ms and a min of 39ms for an avg of 43.5ms. That is pretty much even for performance; note that the first loop takes the longest for both. Now, for 2.0.1, things look much better: the max is 38ms and the min is 21ms for and avg of 27.7ms - a big improvement over both. The improvement can be attributed to a re-worked IO/transport layer and refactoring; the client should be even faster in subsequent releases (remember it’s new code, so it will take a bit to optimize).
The reason the implementation is as it is (and not the same as 1.3.X), is that when it was tested, it was pretty close performance-wise to 1.3.X, but much less complex. Now, that being said, the internal implementation may change in future releases, but only if it’s proven to be substantially faster than the current implementation and more stable.
Thanks!
-Jeff