Hi,
I have big cluster on aws consists of 10 R3.4Xlarge instances with 122G each. each node has 72G quota.version 4.6 community .
after rebalance most of the nodes filled up to about 100G way more than its quota. and i cannot rebalance anymore without impact to the application. I cannot allow downtime by any circumstances. but rebalance now forces me to downtime. I know that restarting the node resolve this memory leak issue, but it takes about 25 minutes to warm up because of its size. I dont want to take chance and restart all the nodes together, risking one of them will not succeed to restart. and in any case this is long downtime. is there a way to clean the memory without restarting the node?
I thought about it. that’s probably the best workaround for the situation. but you must agree that it doesn’t make any sense that database like Couchbase cannot be robust as expected. i mean, after every rebalance or two
memory is filled up to the point that the application is unstable, which forces me to migrate all my data to different cluster with XDCR
I run 4.6 community version. i ran only data service. my documents are legacy, binary documents.
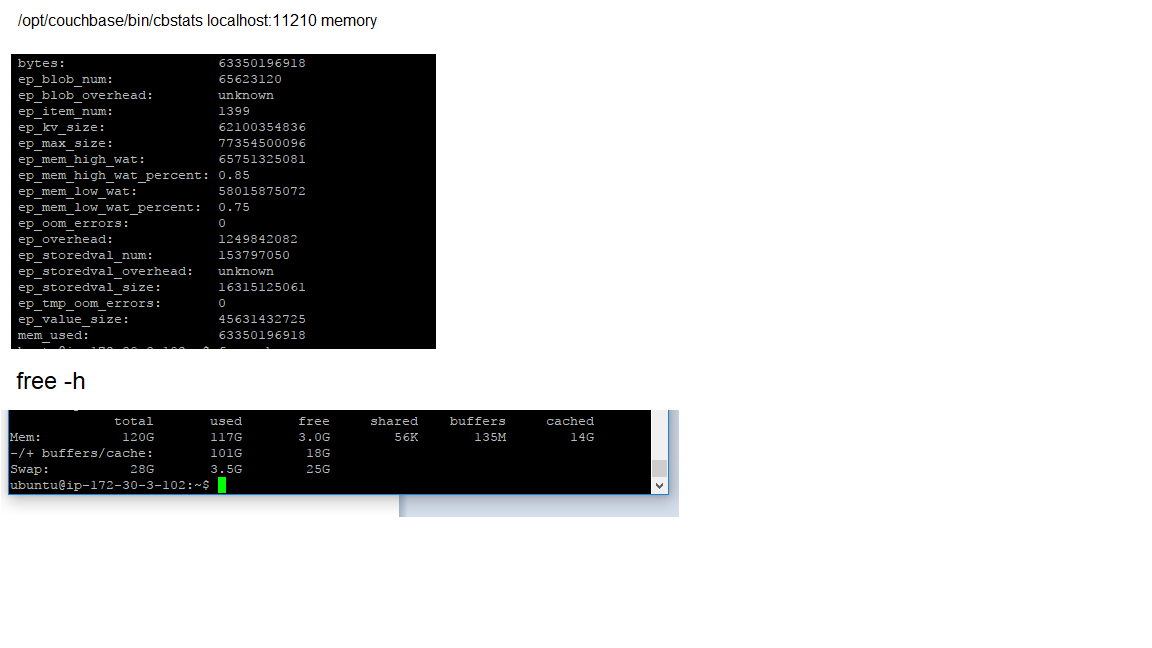
my ep_kv_size is 62G (per node which means the whole size is about 620G. In fact currently my cluster occupies 1T which is unreasonable)
Added screen shots of cbstat memory (from some reason I cannot get allocators data i get an empty result)
Ok, so from your numbers is appears that bucket has 63GB used by the Data Service, and the total machine memory usage is 101G. I’d next suggest looking at top or similar and seeing exactly which process(es) are consuming that (RSS).
cbstats allocator not working sounds strange - exactly which build of 4.6 and which OS are you running on?
I’m running Ubuntu 14.04.5 LTS
Couchbase Version: 4.6.0-3453 Enterprise Edition (build-3453)
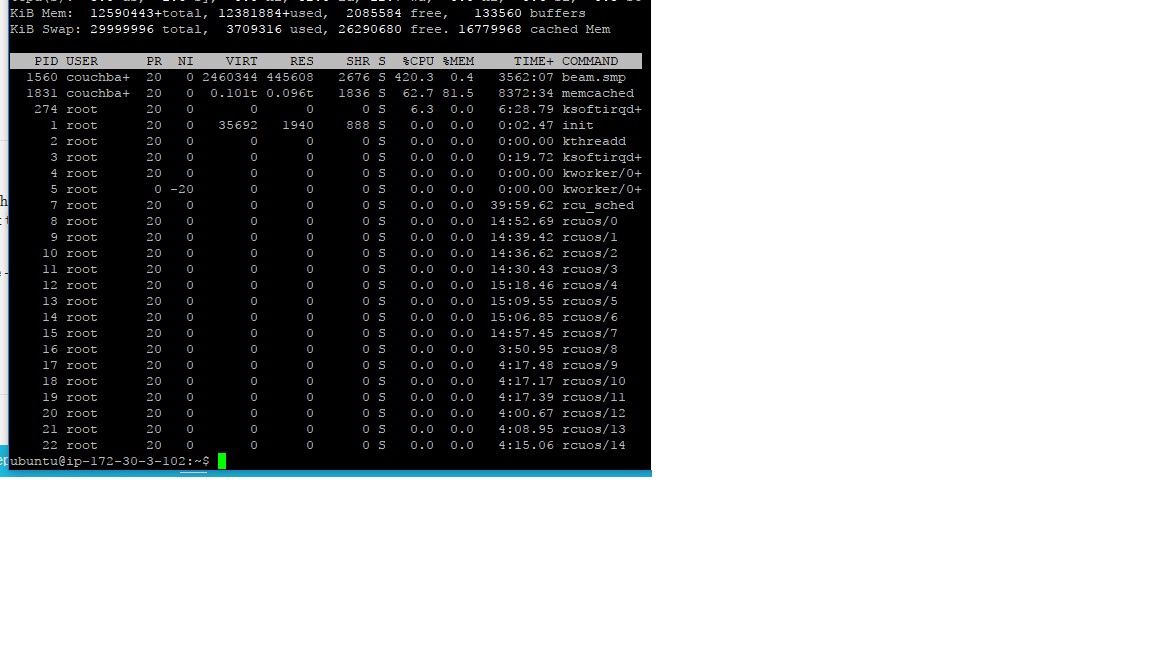
here is my top command it appears that memcached occupies 100G
Thanks, my swapiness is set for 0. I set it to back to 0 after i noticed the swap usage increases after restarting the node on previous issues.
I agree that in right now the best tactical solution is XDCR as you mentioned earlier.
1.How Many buckets do you have?
2.How Many Replicas do you have per bucket?
3.What percentage of your active data is in memory?
4.What percentage of your replica data is in memory?
— If for answers for 3 & 4 are below 20-30% you might be a good candidate for FULL VALUE EJECTION bucket type.
5.Whats your use case?
If you have a high mutation rate the 100GB vs 62GB could be b/c of memory fragmentation is memcached which is normal.
Also is 62GB active data only or Active + Replica Data ???
Let me tell you that i restarted all the nodes a few days prior the rebalance , and reset my cluster (all was normal without excessive memory consumption). it was way to large so i removed 2 nodes, and rebalanced ending up in this state.
I’ll use XDCR and see how it goes, if you have more ideas how work it I’d be happy to hear.
something sound very weird to me with the ram requirements you suggest here.
if you look carefully in the data you will see that my working set => the actual data my application needs is less than 250G. all i actully need is 250G ram the rest can be brought from the disk according to the LRU algorithm.
the problem is that this cluster cannot perform rebalance while the application is up. so what you actually
saying is if you want to rebalance you must have 1.3T+ cluster?! isnt that sound exaggerated?!
If you look at:
Doc Data Size(650GB) vs you doc Total disk size(902GB). This is what your data looks like on disk. so what that tell me is that your use case is not a pure GET but a mix of Reads and Updates.
The same thing is also happening in your memory where over time you’ll get alot of Memcached class size differences on updates(fragmentation).
If you look at doc fragmentation % over you a day or week or month … would would see it go up and down.
You currently are at 40% active memory percentage.
I’ve seen cluster with less 1% of active docs in memory with 0% of replicas in memory. Now that was a candidate for FULL EJECTION Bucket type.
80%(100GB) of system memory usage by memcached.bin = Data (55~GB) & META(15~GB) in memory @ 40% active ration is a not a bad thing because Memcached is managing its memory space via Value Ejection.
Example if you put double your data from (55~GB) to 100GB you memory would not got to 200GB, it might be about the same probably a little more, you would see you active working set be 5% or lower.
It was never clear how your application being effected by rebalance?
Could the cluster never complete rebalance?
Thus your cluster was not in a safe state of data being balanced in the cluster
2.Did your application see timeouts during rebalance?
ok, let me take you little bit back.
The cluster used to work for long time with 5 nodes of 122G. the resident was about 15% or even less. and my miss cache ratio was 0 (that’s means working set is actully very small compared to the 900G you talked about earlier). It was on the high water mark level of course. but application was just fine. (well… maybe response times gradually slowed but nothing serious.)
one day at October one of the nodes failed due to amazon problem (I think…) and than hell broke lose. I immediately added 2 nodes, but the rebalanced failed over and over because every time another node got into pend state becuase its Ram filled up. It happened few more times during the last month and finally I ended up with 12!! nodes and after I had to restart the nodes because even with 12 nodes some of them were almost in 100% ram usage and the application got errors from the cluster. after restarting them the cluster was OK - hence each node occupied keys+values+metadata. That’s how i expected the cluster to behave.
of course 12 nodes are unacceptable so i started to remove nodes (one by one) assuming the cluster is stable now. and than again after removing 2 of the nodes I saw the fast growth of the Ram and stopped were I am now.The application was ok during the first rebalance, but in the second one when ram got to about 100G it started to return empty results and failed to set data or unable to locate node, then again we had to downtime our application.
summarizing things - it is very weird that the cluster behaves well and as expected during normal times, but on stress it must hold at least 5 times of ram than the application actually needs that’s what bothering me the most.
Its would be hard to diagnosis certain failure that happen weeks ago as the Couchbase Logs have rotated over them.
Maybe , but they might have been so low they averaged less the 1 percent.
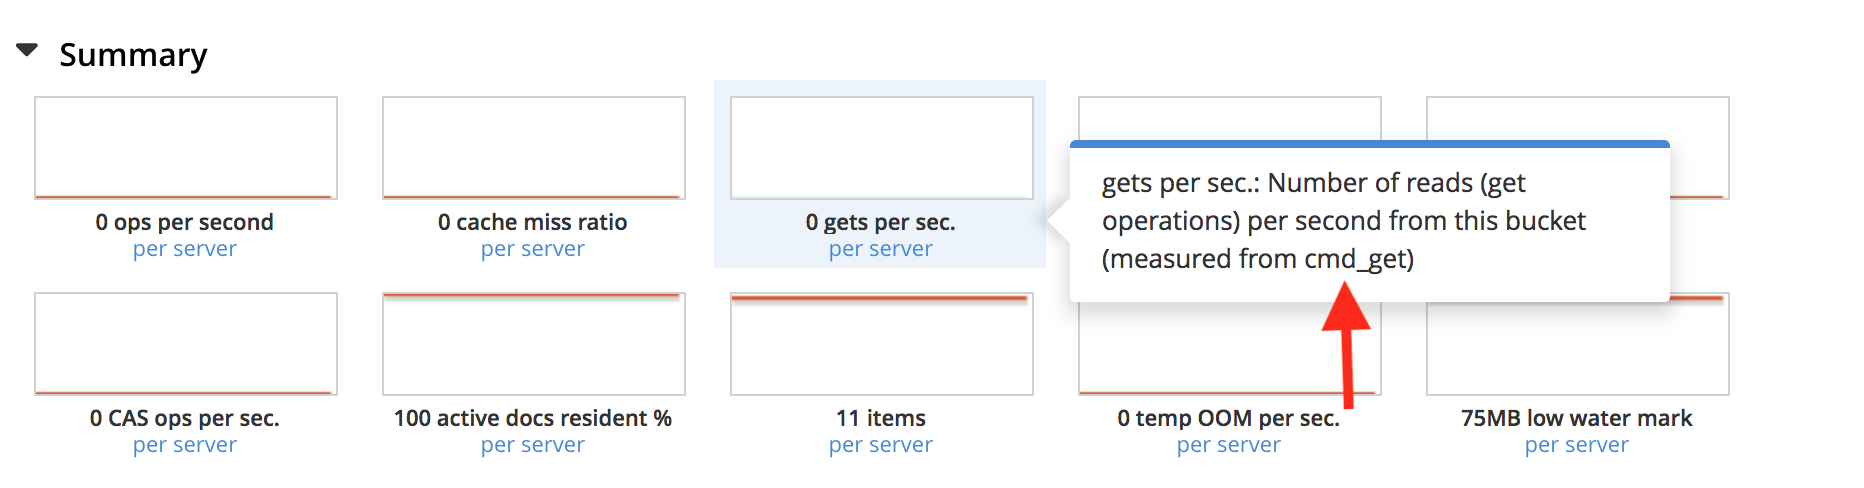
If you look at the SUMMARY page there are some Cache Miss. You see them in the “Disk Reads per second”. and you can see them in the “bg wait time” stats as CB process takes time to pull data from Disk.
To get a more accurate view on performance on GET/SET …etc and any disk operations you can use
cbstats timings. Hope fully it should all be in microseconds and some milliseconds.
if you put in localhost:11210 you will get stats of the localhost.
if you put in localhost:11211 it will get Moxie to pull stats from the whole cluster.
SWAPPINESS
In your case I’m worried about your swap usage. It should be close to zero https://www.cyberciti.biz/faq/linux-which-process-is-using-swap/
Could you double check if any of Couchbase’s process are using it
and if so if its being release over time.
Swap is used by couchbase.
it was always on 0. after the first failure it begun to fill up even though it was on 0.
after i restarted the nodes. it returned back to 60. and I manually set it back to 0. now it slowly goes down.