Not sure 100% of timeline and cluster size during the timeline , but sounds like after a node fail over the node(s) and it didn’t have alot of capacity so it went to swap but know you have lot of capacity so swap was only used on the nodes that were rebooted with the swappiness = 60(Default).
COST It sounds like your in a good spot right now , my first suggesting of XDCR to another cluster I don’t think you need. If cost is an issue you might want to go down a few nodes = less active docs in memory though.
or
If your ok with the 42% active ration and want less machine , I would still suggest you increase your bucket allocation from 72GB to something less then 100GB and remove a node or two.
REPRODUCE ISSUE
But you do want to figure out the timeout and performance issue from a few months ago. So in a lower environment set up a 3 nodes cluster with XYZ % of data in production and test failure scenario when couchbase nodes go down.
Is the SDK not getting an updated cluster map even after auto-failover?
Is my out autofailover set to high and the timeout on my SDK set to low?
Thank you very much for you details responses.
I adopt your Idea and will try to reproduce the issues.
Having said that, I’m not convinced that 62G data and 15G metadata requires 100G of ram and especially over usage of the cluster quota.
i’d expected the cluster to use exactly what was allocate to it, if i hit the water mark than ejections occurs. the 50G should be used to handle rebalances and stress times. that’s how i see it.
my hunch is that something isn’t working well in terms of memory management during the rebalance which causes over usage of cluster quota. currently i’m sure that my cluster as is cannot rebalance without affecting the application, (just because i learned the hard way that when the cluster is over used its quota - that’s a fact) therefore I think I’ll do XDCR and will update here how the cluster continue to behave, I’m sure others will be interested in that too
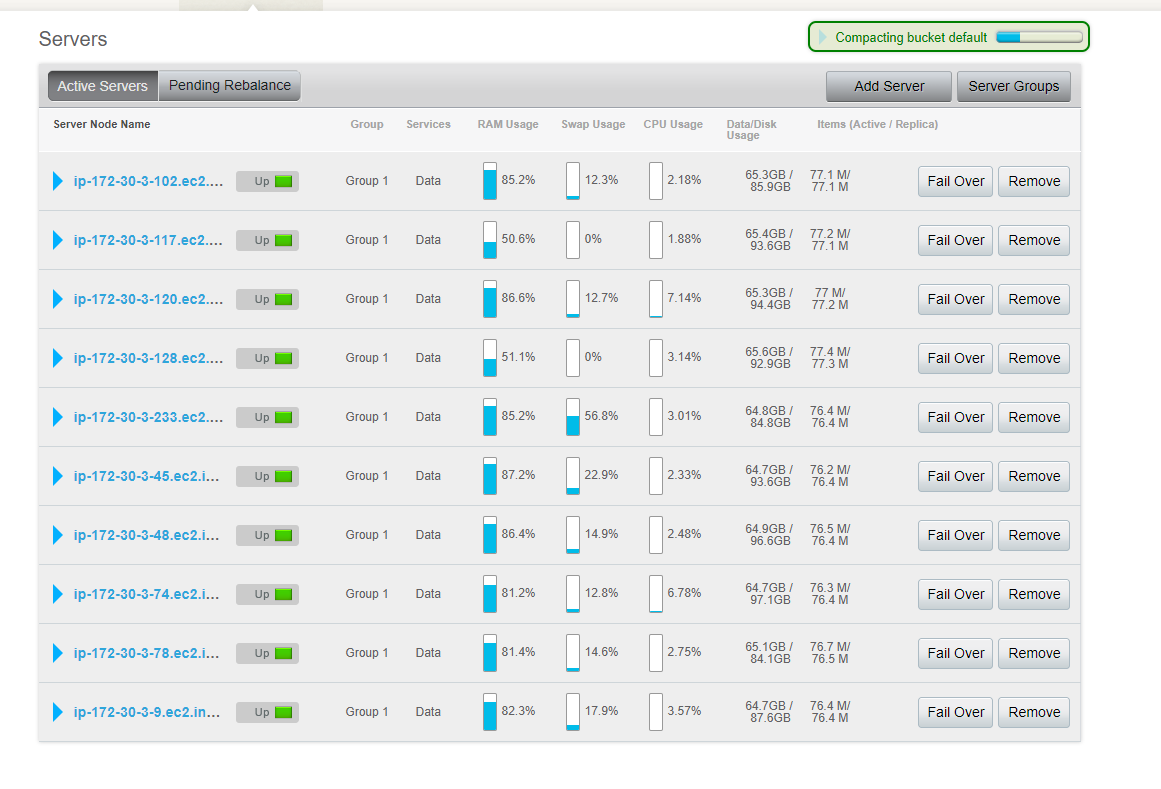
So, I did XDCR, this is the “before” cluster with 10 nodes, it also had 150G in metadata and 550G of data in ram, cluster size is about 900G, 0 cache miss ratio 0 reads from disk
this is the “after” 150G metadata 450G in data ram, cluster size is the same, 0 cache miss rarion 0 reads from disk, the ram didn’t exceed the 70G that it was allocated during the XDCR as expected, now this is an healty cluster I hope and expected next time i rebalance it the ram will not be affect and allow smooth process.