Hi,
I’m using couchbase server 5.1 running on Centos 7. There are some buckets on this db server:

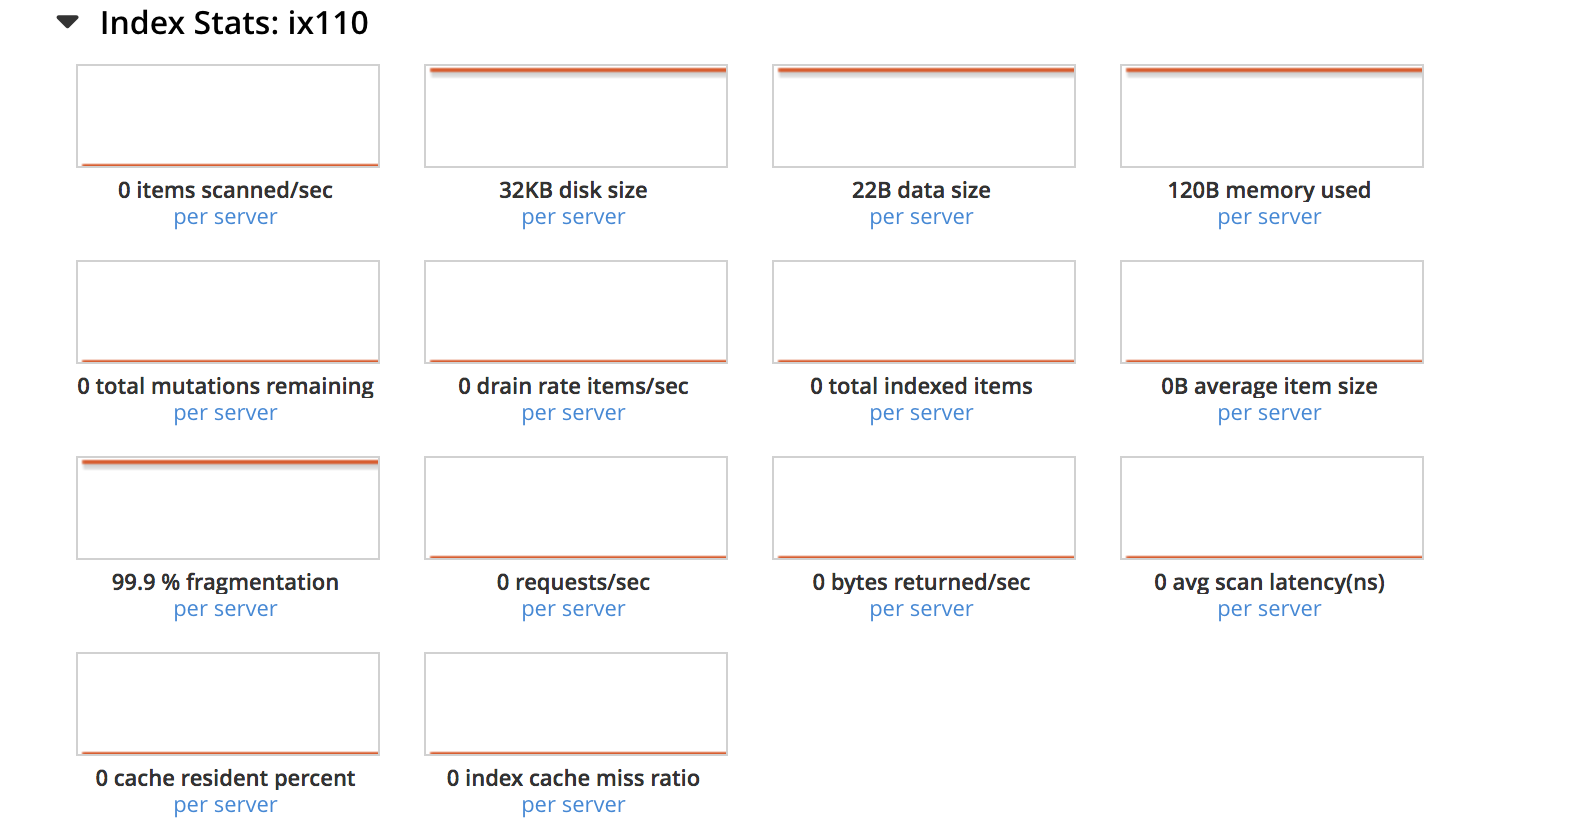
On “News” bucket, there is only 800 records and a cover index already created:
CREATE INDEX news_type_cate_all2_idx ON News(newsType,cate,dateTimeCreated,alias,content) WHERE (type = “News”)
But this query still take 600ms to 1500ms to run:
select content, alias, cate,dateTimeCreated from News where type = 'News' and newsType='news' and cate='thi-truong' order by dateTimeCreated desc limit 15 offset 0
The loading of machine, I checked also got no problem, CPU is very free :

I have another development server, which is having only “News” bucket and running this cmd is fast, only took 200ms.
This is exec plan on problem server:
{
“#operator”: “Sequence”,
“#stats”: {
“#phaseSwitches”: 2,
“execTime”: “2.12µs”,
“kernTime”: “1.542978677s”
},
“~children”: [
{
“#operator”: “Authorize”,
“#stats”: {
“#phaseSwitches”: 4,
“execTime”: “5.471µs”,
“kernTime”: “1.541809468s”,
“servTime”: “1.13152ms”
},
“privileges”: {
“List”: [
{
“Target”: “default:News”,
“Priv”: 7
}
]
},
“~child”: {
“#operator”: “Sequence”,
“#stats”: {
“#phaseSwitches”: 3,
“execTime”: “3.611µs”,
“kernTime”: “1.541794638s”
},
“~children”: [
{
“#operator”: “Sequence”,
“#stats”: {
“#phaseSwitches”: 2,
“execTime”: “1.678µs”,
“kernTime”: “1.541553633s”
},
“~children”: [
{
“#operator”: “IndexScan2”,
“#stats”: {
“#itemsOut”: 430,
“#phaseSwitches”: 1723,
“execTime”: “3.213124ms”,
“kernTime”: “1.348019ms”,
“servTime”: “1.536882351s”
},
“covers”: [
“cover ((News.newsType))”,
“cover ((News.cate))”,
“cover ((News.dateTimeCreated))”,
“cover ((News.alias))”,
“cover ((News.content))”,
“cover ((meta(News).id))”
],
“filter_covers”: {
“cover ((News.type))”: “News”
},
“index”: “news_type_cate_all2_idx”,
“index_id”: “f150c54a5cd26f7a”,
“index_projection”: {
“entry_keys”: [
0,
1,
2,
3,
4
]
},
“keyspace”: “News”,
“namespace”: “default”,
“spans”: [
{
“exact”: true,
“range”: [
{
“high”: “"news"”,
“inclusion”: 3,
“low”: “"news"”
},
{
“high”: “"thi-truong"”,
“inclusion”: 3,
“low”: “"thi-truong"”
}
]
}
],
“using”: “gsi”,
“#time_normal”: “00:01.5400”,
“#time_absolute”: 1.540095475
},
{
“#operator”: “Sequence”,
“#stats”: {
“#phaseSwitches”: 5,
“execTime”: “3.427µs”,
“kernTime”: “1.541525587s”
},
“~children”: [
{
“#operator”: “Filter”,
“#stats”: {
“#itemsIn”: 430,
“#itemsOut”: 430,
“#phaseSwitches”: 1725,
“execTime”: “1.700648ms”,
“kernTime”: “1.539774465s”
},
“condition”: “(((cover ((News.type)) = "News") and (cover ((News.newsType)) = "news")) and (cover ((News.cate)) = "thi-truong"))”,
“#time_normal”: “00:00.0017”,
“#time_absolute”: 0.001700648
},
{
“#operator”: “InitialProject”,
“#stats”: {
“#itemsIn”: 430,
“#itemsOut”: 430,
“#phaseSwitches”: 1727,
“execTime”: “1.69514ms”,
“kernTime”: “1.539812941s”
},
“result_terms”: [
{
“expr”: “cover ((News.content))”
},
{
“expr”: “cover ((News.alias))”
},
{
“expr”: “cover ((News.cate))”
},
{
“expr”: “cover ((News.dateTimeCreated))”
}
],
“#time_normal”: “00:00.0016”,
“#time_absolute”: 0.0016951400000000001
}
],
“#time_normal”: “00:00.0000”,
“#time_absolute”: 0.000003427
}
],
“#time_normal”: “00:00.0000”,
“#time_absolute”: 0.0000016779999999999999
},
{
“#operator”: “Order”,
“#stats”: {
“#itemsIn”: 430,
“#itemsOut”: 15,
“#phaseSwitches”: 895,
“execTime”: “1.672247ms”,
“kernTime”: “1.539968818s”
},
“limit”: “15”,
“sort_terms”: [
{
“desc”: true,
“expr”: “cover ((News.dateTimeCreated))”
}
],
“#time_normal”: “00:00.0016”,
“#time_absolute”: 0.001672247
},
{
“#operator”: “Limit”,
“#stats”: {
“#itemsIn”: 15,
“#itemsOut”: 15,
“#phaseSwitches”: 65,
“execTime”: “10.28µs”,
“kernTime”: “1.541671615s”
},
“expr”: “15”,
“#time_normal”: “00:00.0000”,
“#time_absolute”: 0.00001028
},
{
“#operator”: “FinalProject”,
“#stats”: {
“#itemsIn”: 15,
“#itemsOut”: 15,
“#phaseSwitches”: 67,
“execTime”: “16.176µs”,
“kernTime”: “1.54175627s”
},
“#time_normal”: “00:00.0000”,
“#time_absolute”: 0.000016176
}
],
“#time_normal”: “00:00.0000”,
“#time_absolute”: 0.0000036110000000000002
},
“#time_normal”: “00:00.0011”,
“#time_absolute”: 0.001136991
},
{
“#operator”: “Stream”,
“#stats”: {
“#itemsIn”: 15,
“#itemsOut”: 15,
“#phaseSwitches”: 37,
“execTime”: “4.952µs”,
“kernTime”: “1.542964694s”
},
“#time_normal”: “00:00.0000”,
“#time_absolute”: 0.000004952
}
],
“~versions”: [
“2.0.0-N1QL”,
“5.1.1-5723-enterprise”
],
“#time_normal”: “00:00.0000”,
“#time_absolute”: 0.00000212
}