Upsert High CPU Usage

Hello Everyone,

I’m running some test apps I have built, and I’m just trying to ascertain if this is normal behaviour or not.

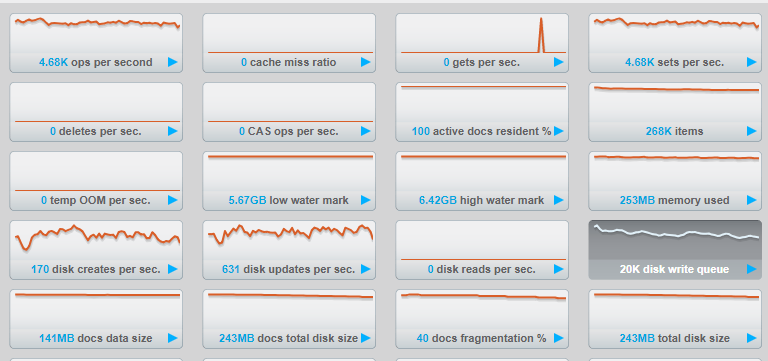
I have a high frequency app, that I have currently stunted to about 5k ops/second

Everytime I call Upsert on the documents generated by this app, my CPU AND Disk go to 100% usage.

I am running : 4.6.2-3905 enterprise version with the latest CouchbaseNetClient

Both systems are running as single nodes, not a cluster.

My Hard Drives are both SSD.

One is a DELL XPS, m.2 1TB Drive. This machine has a 4c/8t i7 6700hq chip @ 2.6 ghz with turbo up to 3.5ghz and 32gb ddr4 RAM

The other machine is slightly older, but still a respectable i7 980x 6c/12t CPU, with an Samsung 850 PRO SSD, with 24gb RAM.

I believe both of these machines should be well and truly capable of handling 5k/second Upserts.

When I comment out the lines of code that do the Upserts, my CPU usage remains virtually unchanged to when the app was started, even though it is still doing a fair bit of logic work.

When I add the lines back in, then the CPU/Disk usage surges to 100% and PC becomes unusable.

So I uninstalled Couchbase on the XPS and reinstalled it as a Memcached server only. As expected, the Disk now stays at a very low rate of 1% but the CPU is still 100%. Again, comment the lines out of the Upsert and CPU usage goes right down.

Although I have been playing around with couchbase for a bit, I must admit I’m no expert and there is a chance I have missed something extremely basic in the config/setup that needed to be done.

I have even separated out the Serialisation to outside the Upsert function, and passed Upsert itself a raw string, thinking it may be the serialisation overhead, but that wasn’t the case at all. The objects are very small.

Looking for advice and guidance.

Regards,

Marek

Just another Edit (hacked this together, and models changed due to confidentiality)

{“Position”:10,“Type”:0,“Type2”:5,“Value”:0.0,“Type3”:1,“Place”:“Bla”,“Type”:“Ex”,“Id”:“11111”}

public class RootObject
{
    public int Position { get; set; }
    public MyFirstType Type { get; set; }
    public MySecondType Type2 { get; set; }
    public double Value { get; set; }
    public MyThirdType Type3 { get; set; }
    public string Location { get; set; }
    public string Id { get; set; }
}

public enum MyFirstType
{
    A,
    B
}

public enum MySecondType
{
    C,
    D,
    E,
    F,
    G,
    H
}

public enum MyThirdType
{
    I,
    J
}
public class CouchBaseInstanceTest
{
    private Cluster CouchClient;
    private IBucket Bucket;

    public CouchBaseInstanceTest()
    {
        CouchClient = new Cluster(new ClientConfiguration
        {
            Servers = new List<Uri> {new Uri("http://localhost:8091")}

        });
        // If required
        //CouchClient.Authenticate("admin", "password");  
        Bucket = CouchClient.OpenBucket("default");
    }
    public bool Upsert(string key, dynamic value, double expiry)
    {
        var Document = new Document<dynamic>()
        {
            Id = key,
            Content = value,
            Expiry = TimeSpan.FromHours(expiry).ToTtl()
        };
        return Bucket.Upsert(Document).Success;
    }
}

To be honest though, the code here is really irrelevant I think. When I replaced the document values with a blank string “” - The problem was still the same

@MChud -

What does the code look like that’s calling CouchBaseInstanceTest class?

I subscribe to a stream which gets quite frequent, live data.

As part of that process I receive the data and want to send it to Couchbase:

foreach (IRootObject ThisRootObject in RootObjects)
{
        string ObjectKey = "MyGeneratedKeyWhichChangesWithEachIteration";
        CouchClient.Upsert(ObjectKey, ThisRootObject, 12);
}

Further onto this, I have put the same program(s) on a VM. As you can see, the CPU usage is very high. 16 cores E5 2620 v2 @ 2.6 ghz base and it’s 81% capacity.

I really refuse to believe that I’m hitting such CPU capacity on 5k upserts/second…I mean, am I expecting too much, or is this just normal?

image

image

@MChud -

It seems high - I’ll try to replicate using your code and data. BTW, a better way to send large amounts of data is to use the async API:

       var docs= new List<IDocument<object>>
        {
            new Document<object>{Id = "doc1",   Content = new {Name = "bob", Species = "Cat", Age = 5}},
            new Document<object> {Id = "doc2", Content = 10},
            new Document<object> {Id = "doc3", Content = new Cat {Name = "Cleo", Age = 10}}
            ...
        };
        await _bucket.UpsertAsync(docs).ConfigureAwait(false);

Internally a List<Task<IDocumentResult>> is created by calling UpsertAsync and then that list is passed into Task.WhenAll - the pattern can be reused with other constructors and operations.

Thanks for taking this further.

FYI I made the recommended changes to Async. I did have an UpsertBulk function that I wrote yesterday, but it wasn’t Async.

Unfortunately, same result still (both yesterday’s Sync and your suggested ASync).

I forgot to mention, that I also Updated one of the machines to the latest version, hoping for a miracle, but alas, none came.

How many writes/sec would you expect to see on a machine with the specs that I have provided?

@MChud,

You can see some of the benchmarks that we run here: http://showfast.sc.couchbase.com though I believe most of these involve at least a 2 node cluster.

@MChud

What kinds of secondary indexes or views exist on the bucket? Could processing these be causing the problem?

1 Like

I don’t believe so. One of these was was a fresh install even, and most of my code is purely as KV storage/retrieval, for speed purposes.

Ok, Well I’m not getting anything approaching those figures.

Granted, Newer/Faster/Better and More VCpu used in these examples, and of course, multiple nodes.

Notwithstanding this, I would have thought with my 16 VCpu machine it would have looked better than it does.

I must say, That the streams I subscribe to, are highly concurrent, So I would be hitting the Upsert simultaneously, but once again, I would have thought Couchbase could handle this (and was really purpose built for these sorts of scenarios). Seeing the quoted figures above, I am a little more perplexed at my bottleneck situation.

I do see a couple of issues in your code:

  1. You are reusing the same key so you end up with a single document that keeps getting upserted:

foreach (IRootObject ThisRootObject in RootObjects)
{
string ObjectKey = “MyGeneratedKeyWhichChangesWithEachIteration”;
CouchClient.Upsert(ObjectKey, ThisRootObject, 12);
}

  1. Your calling ToTtl() on the expires field which then gets called internally by the SDK again with a side effect of reducing the TTL to ~43 seconds for the document. You should change the code so it looks like this:

var Document = new Document()
{
Id = key,
Content = value,
Expiry = (uint)TimeSpan.FromHours(expiry).TotalMilliseconds
};

Aside from the I suspect its related to server configuration or OS, assuming fixing those issues does nothing. If so, its probably better to get someone from the server side to respond.

Hi,

The key i am using is generated per iteration, based on variables. This was merely an example.

They are all in the format of ThisPortion::ThatPortion::NextPortion etc.

I then have, for all this data a referral document that contains all the keys relevant for all the pieces of data I may need for that particular set of information.

So: ReferredSet::ThisPortion as an example. This way my one referral document is all I need and I can keep my server as a pure KV storage mechanism, and thus, retain as much speed as possible.

I applied your suggested changes and it made no difference to the end result.

OK - So Let’s take this further, I really want to see if some sort of config is the culprit here - Where/How do I proceed to get someone from Server side to look please?

Thank you.

@MChud, when you comment the Upsert line out, how many events per sec does your app handle from the real-time stream? Just trying to get an idea of how far below your maximum possible throughput you are with the 5k ops/sec.

@graham.pople It sounds like he is reaching is desired 5k ops, with the side effect of high CPU on the server - perhaps a tuning issue? Perhaps @pvarley can help here?

@MChud - have you tried installing the server on a linux flavor?

Graham,

Jeffry has it correct below. The real time stream is actually being handled, but effect of the high CPU renders the machine(s) useless.

The app itself might be utilising 1-5% CPU on its own, but once that Upsert command is put back in, the needle goes straight to 100%.

The problem I have is - I will have multiple data streams like this, all upserting at high frequency, Then on top of all this, I will have apps that will need to read all of this data, as a form of “aggregration”, for me to then do what I need to do with it.

Unfortunately I’m virtually stuck at Step 1 of the process due to the CPU being eaten alive (if memcached bucket only) and both CPU AND Disk if Couchbase (preferred setup)

Jeffry,

You are spot on. I have no room to move for additional applications on the node due to this side effect.

Linux…is a tough one for me…everything I deal with is primarily built around the Microsoft tech stack. I guess I could install a Linux flavour on a VM as a test, and then have my apps, running from the Windows machine(s) establish connections to that server rather than localhost:8091? I’ve never done this before so not sure if its possible to connect from Windows machine into a Linux machine just by changing my app config (Server Uri). Which version would you suggest me to install as a guest OS, if this is possible?

Ideally though, I would like to see if what I am seeing can get resolved, as i’m seeing the exact same thing across 3 machines.

2 x Windows 10 x64
1 x Windows Server 2016 x64

Howdy,

I’m a little late to the party, apologies if these questions have already been answered:

  • The documents are small, how small is small? Is it possible to get a sample document?
  • The application and Couchbase Server are running on the same machine, correct?
    • The two different machine (XPS and older) are just different test environments?
  • What version of the .Net SDK being used?
  • Using an encrypted connection?

I would recommend upgrading to Couchbase Server 4.6.5 at the very least, if not to Couchbase Server 6, just in cases it’s a issue that has already been fix. (Looking at the release notes nothing jumps out but it’s always good to be on the latest version)

The other thing I would recommend is trying cbc-pillowfight to generate a the workload, you can pass in a doc that it will use for inserting and you can control the batch size and the rate of reads and writes operations. It wonder be good to know either way if the issue can be reproduced with pillowfight.

I can happily do 30K inserts on 2015 Mac Pro with 16Gb RAM and 4c/8t CPU without pushing it to the wall, so maxing out at 5K seems strange, I suspect we must be missing something (maybe a word :blush:)

The other think that seem odd here is in the screenshot all of the CPU cores are maxed out. I would expect memcached at the max with a single application connected to use around 5 CPU cores. That would be 1 frontend thread handling the network connection from the client and 4 writer threads updating the disks.

On the SDK side there are a number of threads but again I be surprise if that would add up to 11 cores.

I also noticed that there is high swap usage in the screenshot, that in itself should not cause hit CPU but it can cause performance issues.

It would be good to understand the break down of CPU usage i.e the application starts using 200% and the memcached process uses 600% from the tests.

Hello there,

A sample document would be:

{“Position”:10,“Type”:0,“Type2”:5,“Value”:0.0,“Type3”:1,“Place”:“Bla”,“Type”:“Ex”,“Id”:“11111”}

where Type,Type2,Type3 are enums.

However, I have actually changed the content of the document on the Upsert to be “” and it is still doing the same thing.

Application and Server, on the same machine,yes.

XPS and older are just different test environments, yes.
The screenshot I sent of the CPU usage was from a VM I have. The other two machines I have access to are spec’d up as per the opening post.
SDK - I used nuget two days ago for the SDK, so presume it is the latest possible (2.7.1)

The XPS, for the avoidance of doubt, I uninstalled the previous version (4.6.2) I had and downloaded and installed the latest off the website - Enterprise build 6.0.0 build 1693 - IPV4 it tells me on the dashboard - to no avail, same issue.
My installs are basically follow the rolling ball defaults and auto populated by the setup process.

In your post you say that " I suspect we must be missing a" … I would love to know what we are missing :slight_smile:

The stream I am using, is highly concurrent in and of itself, but I wouldn’t have thought that it would have bothered couchbase that much. So even though it is a single application,yes, it is highly concurrent.

I will look into cbc-pillowfight

Used the sample command straight from the blog.

.\cbc-pillowfight.exe -U couchbase://localhost/pillow -u Administrator -P password

This was on the Dell XPS, whose specs are outlined in opening post, with the latest version of couchbase.